Once you have completed your app and posted it to the App Store, nothing beats the feeling of waiting for your first sales report. How many downloads did you get on day one?
Later, you may release updates that add additional functionality to your app. What effect does that have on your app downloads?
What if you changed your icon, or used a new feature screenshot – would that make any difference?
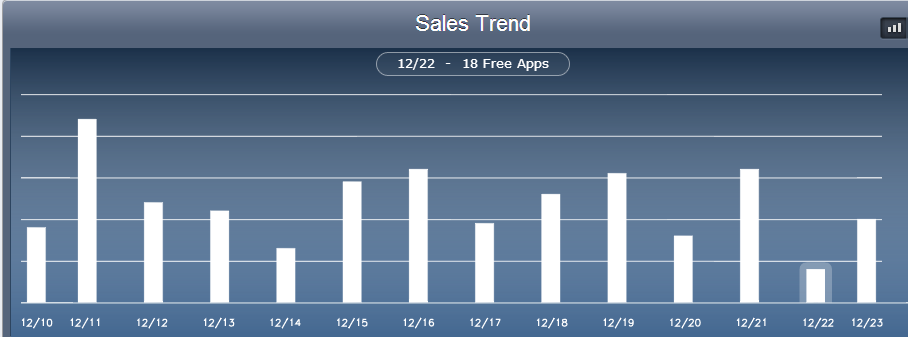
Apple themselves provide you with 7 days of daily sales reports and charts for your apps. These reports can be exported if you want to keep track of longer term trends.

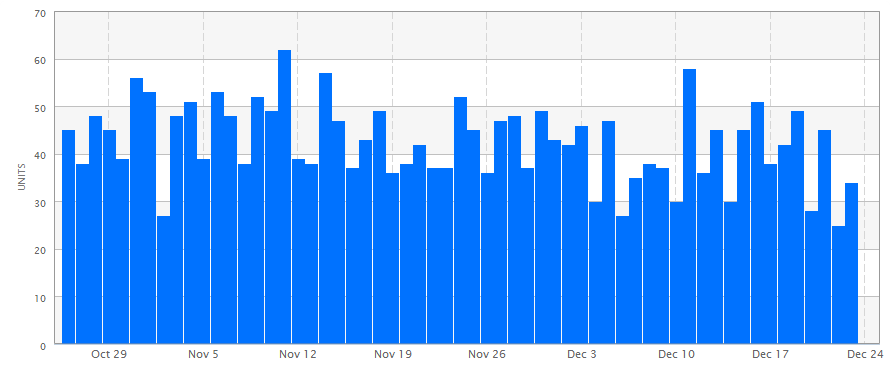
A different service that I highly recommend is appfigures. In addition to providing you daily email reports of your sales (meaning you don’t have to manually check yourself), they automatically archive your long term reports, so you can track longer term trends.

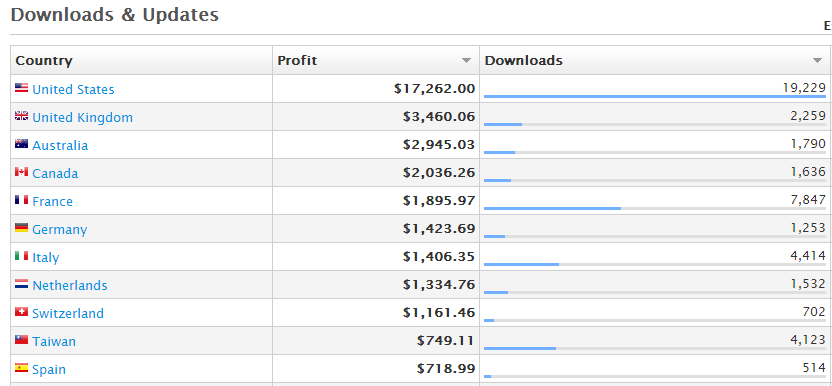
Want more data? Do you know which countries make up your top markets? If not, there is a report for that.

Why is this important? You can take a look at which non English countries make up your top markets, then add additional language localization to serve those markets.
The interface gives you a great overview of how your apps are doing, including reviews and rankings. A lot of this data is available directly from the app store, but the interface here makes it easier to directly receive this information for your app, instead of having to manually search for it.
If you’re not using appfigures now, it’s worth checking it out!
